50 Revealing Mobile Game Monetization Statistics and Facts


Mobile game monetization is all about how games turn play into profit. Developers earn money through in-app purchases, ads, subscriptions, and special features that encourage players to spend. This is why some games rake in billions while others struggle to stay afloat.

Explore key mobile game monetization statistics that reveal who spends, which genres earn the most, and how player engagement drives revenue. From free-to-play (FTP) hits to gacha sensations, you’ll see how different models and demographics shape the mobile gaming landscape.
Mobile Gaming Market Statistics
Recent mobile gaming statistics show that in 2024, global consumer spending on mobile game in-app purchases (IAPs) saw a 4% increase, reaching $80.9 billion. This reflects the growing nature of the mobile gaming market and confidence among gamers to spend on games.
Here are eight more eye-opening stats about the mobile gaming market:
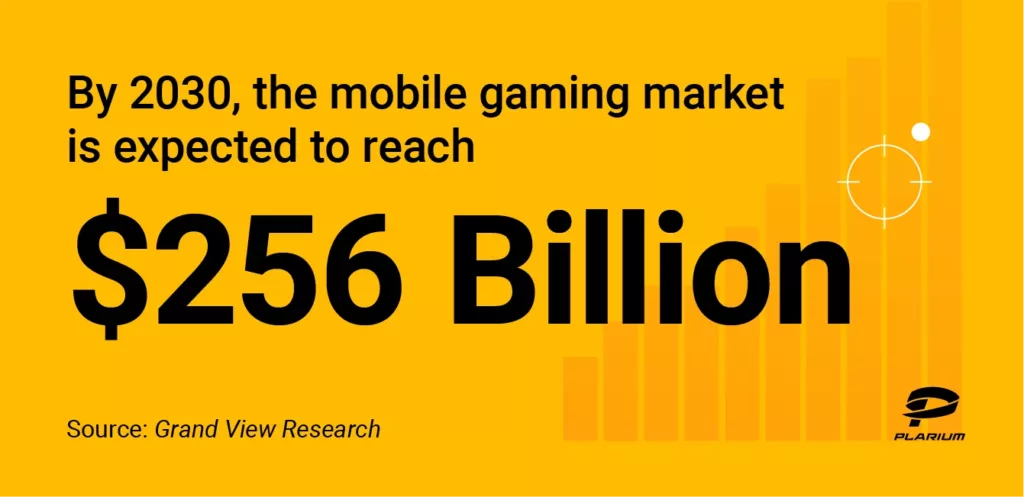
1. The global mobile gaming market was estimated at $139.38 billion in 2024 and is expected to reach $256.19 billion by 2030, growing at a CAGR of 10.2%. (Grand View Research)
2. According to another estimation, the market was valued at $85.73 billion in 2023 and is projected to reach $250 billion by 2035, growing at a CAGR of 9.33%. (Market Research Future)
3. Asia-Pacific (APAC) accounted for the largest revenue share of 52.3% in 2024, making it the dominant region in mobile gaming. (Grand View Research)
4. The Android platform led in revenue share in 2024, capturing about 47.2% of the global mobile gaming market. (Grand View Research)
5. Based on the forecast, the mobile gaming market size by the end of 2025 is expected to be $157.6 billion, up from $139.38 billion in 2024, continuing strong growth. (Grand View Research)
6. By the end of 2025, revenue in the global mobile games market is projected to reach $126.06 billion. (Statista)
7. This revenue is expected to grow at a 5.4% CAGR between 2025 and 2030, reaching $163.98 billion by 2030. (Statista)
8. The number of mobile game users worldwide is forecast to hit 2.5 billion by 2030. (Statista)


Mobile Gaming Ad Spend Statistics
In a survey of over 1,000 gamers, 34.4% cited server lag as their biggest frustration, and 46.8% pointed to ads as their biggest concern. Yet, despite these mixed feelings, mobile ads remain a driving force behind the industry’s revenue growth.
Here are some key stats on in-game advertising and mobile ad spend:
9. Revenue from in-game advertising worldwide is expected to reach $124.45 billion by the end of 2025. (Statista)
10. With a steady rise, the market is forecast to grow at a 7.82% CAGR (2025-2030), hitting $181.36 billion by 2030. (Statista)
11. The average revenue per user (ARPU) in the in-game advertising market is projected at $62.72 in 2025. (Statista)
12. China is set to generate the highest ad revenue, totaling about $52.38 billion in 2025. (Statista)
13. Global spending on mobile in-game advertising is climbing rapidly, reaching over $130 billion in 2024, and is forecast to surpass $150 billion by 2027. (Statista)
Mobile Gaming Monetization Statistics by Demographic
Whether it’s single-player or multiplayer mobile games, monetization strategies shift a lot depending on age, region, and how serious players are. Also, while most players spend little or nothing, a small minority still drives a big part of revenue.
Here are some key stats about the mobile gaming industry monetization by demographic:
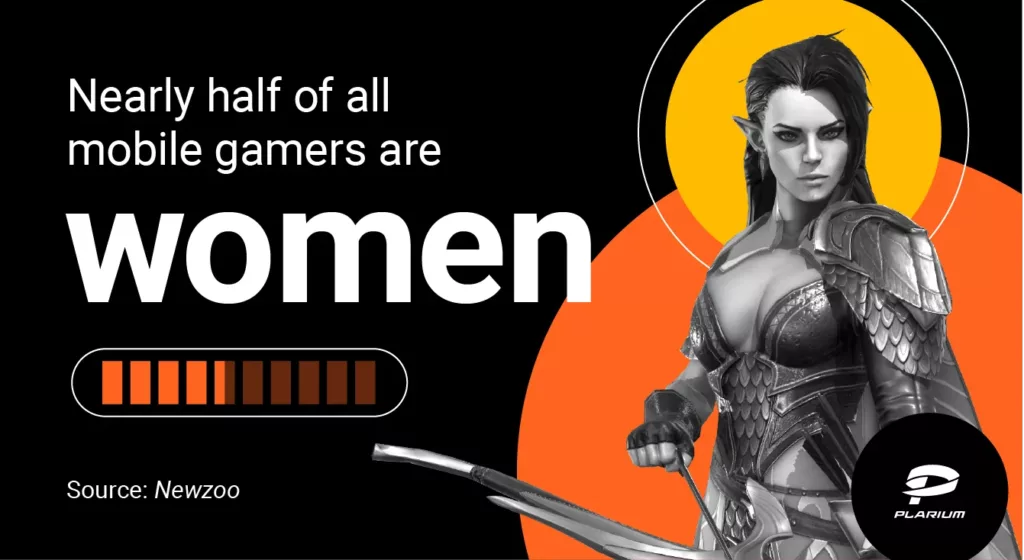
17. In the U.S., the gender distribution among gamers is roughly half male and half female. (Newzoo)
22. Male fans are eight times more likely than female fans to call themselves serious eSports enthusiasts. With fewer women identifying as avid players (2% vs. 17% of men), female gamers typically contribute less spending compared to their male counterparts. (Market.us)
18. Among game genres, younger groups, especially 18-24 year olds, are overrepresented in free mobile games and genres like trivia, music, word games, etc., which tend to monetize via ads or microtransactions rather than full price upfront. (Business of Apps)
19. In the U.S., younger players drive eSports interest — 43% of 18-34-year-olds identify as avid or casual fans. This age group also represents a major chunk of mobile game spenders. (Market.us)
20. About 66% of eSports viewership in 2023 came through official streaming channels, showing the central role of pro streaming in shaping monetization and engagement. (Market.us)
21. The APAC region remains the heart of eSports and mobile gaming, with 80% of fans based there. Of those 80%, 20% are from China, underscoring the region’s dominance in both player base and revenue. (Market.us)
Free-To-Play vs. Pay-To-Play Mobile Game Statistics
F2P games cost nothing to download, but they generate revenue through ads, in-app purchases, or optional upgrades. Think of Candy Crush Saga with its extra lives and boosters, or Clash of Clans, where you pay to speed up progress.
Pay-to-play (P2P) games, on the other hand, require an upfront purchase or expansions — like Minecraft or Grand Theft Auto: San Andreas on mobile. While free mobile games dominate the market, only a small percentage of players — often called whales — actually spend money inside them, driving the majority of revenue.
Here are some key statistics about F2P and P2P mobile games:
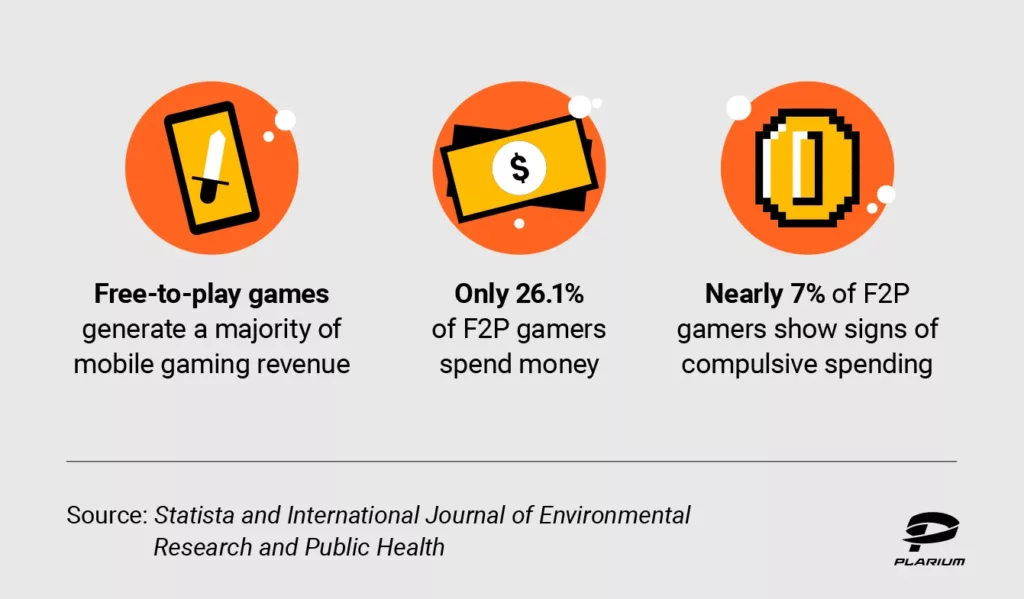
22. In 2023, F2P mobile games generated about $111.37 billion in revenue worldwide, accounting for the clear majority of mobile gaming income. (Statista)
23. A French survey of over 5,000 online gamers found that 68.6% had played F2P titles in the past year, but only 26.1% of those players spent money inside the games. (International Journal of Environmental Research and Public Health)
24. The same study revealed that about 6.9% of F2P gamers showed signs of problematic or compulsive spending, with purchases often tied to motivations like escape, impulsivity, or chasing a sense of flow. (International Journal of Environmental Research and Public Health)
Player Engagement and Retention Stats That Drive Monetization
Player engagement and retention are key factors that drive mobile game revenue. Games that keep players coming back regularly — and for longer sessions — generate more monetization opportunities. Understanding how offline mobile games compare with other platforms, like PC and console gaming, helps developers design better retention strategies.
Here are key stats that reveal how session length, frequency, and platform preference impact monetization:
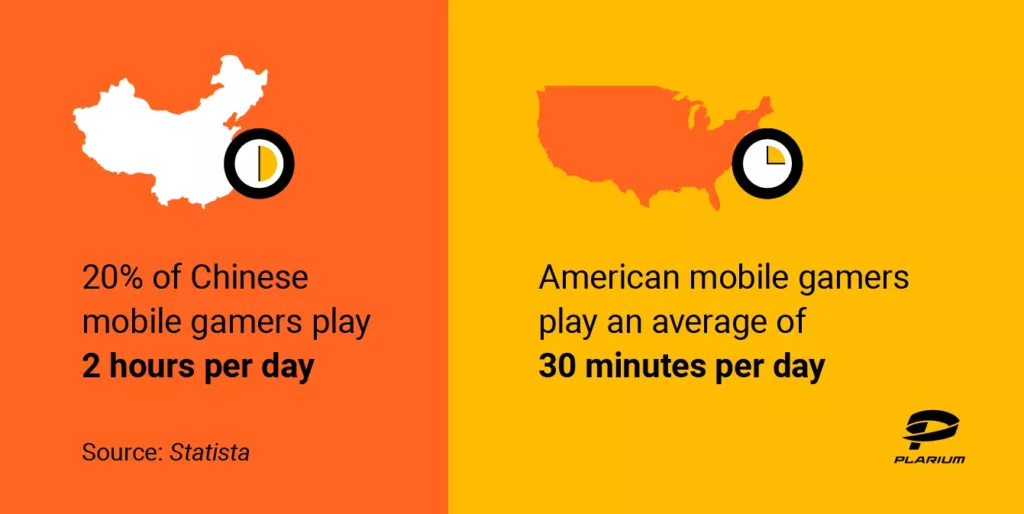
25. In China, 46% of mobile gamers play for more than one hour per session, and 20% play over two hours, making it the country with the longest average session times. (Statista)
26. In the United States, average smartphone gaming sessions last just under 30 minutes, showing shorter but potentially more frequent engagement. (Statista)
27. Peak gaming hours worldwide occur between 7 p.m. and 9 p.m., with 8 p.m. being the most active hour for mobile players. (ByteBrew)
28. Smartphone and tablet games contribute nearly 50% of total video game revenue, showing the dominance of mobile platforms. (Statista)
29. Around 57% of solo gamers say that having social features in games — ways to connect or compete — is an important part of what keeps them playing. (Plarium)
Mobile Gaming Monetization by Genre
Different game genres drive revenue in very different ways. While some categories rely heavily on microtransactions, others thrive on competitive play or social interaction.
Role-playing mobile games (RPGs) like Genshin Impact and Raid: Shadow Legends dominate in-app spending because players are drawn into long-term progression and character upgrades.
Meanwhile, mobile games to play with friends, such as Among Us or PUBG Mobile, monetize through cosmetics, battle passes, and social features that encourage group play and repeat sessions.
Here are the key stats that reveal how genres impact monetization:
30. In 2023, mid-core genres like RPGs, strategy, and shooting games saw a 1.2% increase in downloads year over year, proving these immersive styles remain in demand. (Sensor Tower)
31. When it comes to preferences by gender, women lean heavily toward puzzle games (49.9%) and simulation games (24.4%), while shooter games are far more popular with men (41.2%). (Plarium)
32. Overall, puzzle (36.2%), shooter (33.1%), and strategy (29.6%) are the top three favorite genres for mobile gamers worldwide, showing the strongest monetization opportunities. (Plarium)
33. In 2024, mobile gamers spent $82 billion on in-app purchases, with hybrid casual games leading growth at a 37% revenue increase year over year, outperforming all other categories. (Sensor Tower)
34. Casual games saw the most absolute growth in revenue despite experiencing a 7% drop in downloads, showing that fewer but more committed players are spending more. (Sensor Tower)
35. Strategy hits like Last War: Survival Game and Whiteout Survival ranked among the biggest winners of 2024, with Last War posting the fastest revenue growth of any mobile game worldwide, surging from under $100 million in 2023 to nearly $1.6 billion in 2024. (Sensor Tower)
36. Social-driven titles like MONOPOLY GO! topped global charts in 2024, showing that mobile games to play with friends often monetize more effectively than solo experiences. (Sensor Tower)
Genre-Based Monetization Performance
Some game genres bring in tons of downloads but don’t monetize as strongly, while others with fewer installs earn much more per user. Genres like RPGs and strategy tend to rely on in-app purchases, while casual genres like puzzles and simulators often mix ads and smaller in-app purchases.
Here are some key stats:
37. In Q2 2024, strategy games overtook RPGs as the top revenue-earning genre: Strategy pulled in about $4.15 billion, while RPGs made almost the same but slightly less (and their revenue dropped ~15% year-over-year). (Sensor Tower)
38. During that same quarter, puzzle games, though ranking third in revenue, had far more downloads in total than strategy or RPG genres, showing puzzles’ strength in reach but lower average spend per user. (Sensor Tower)
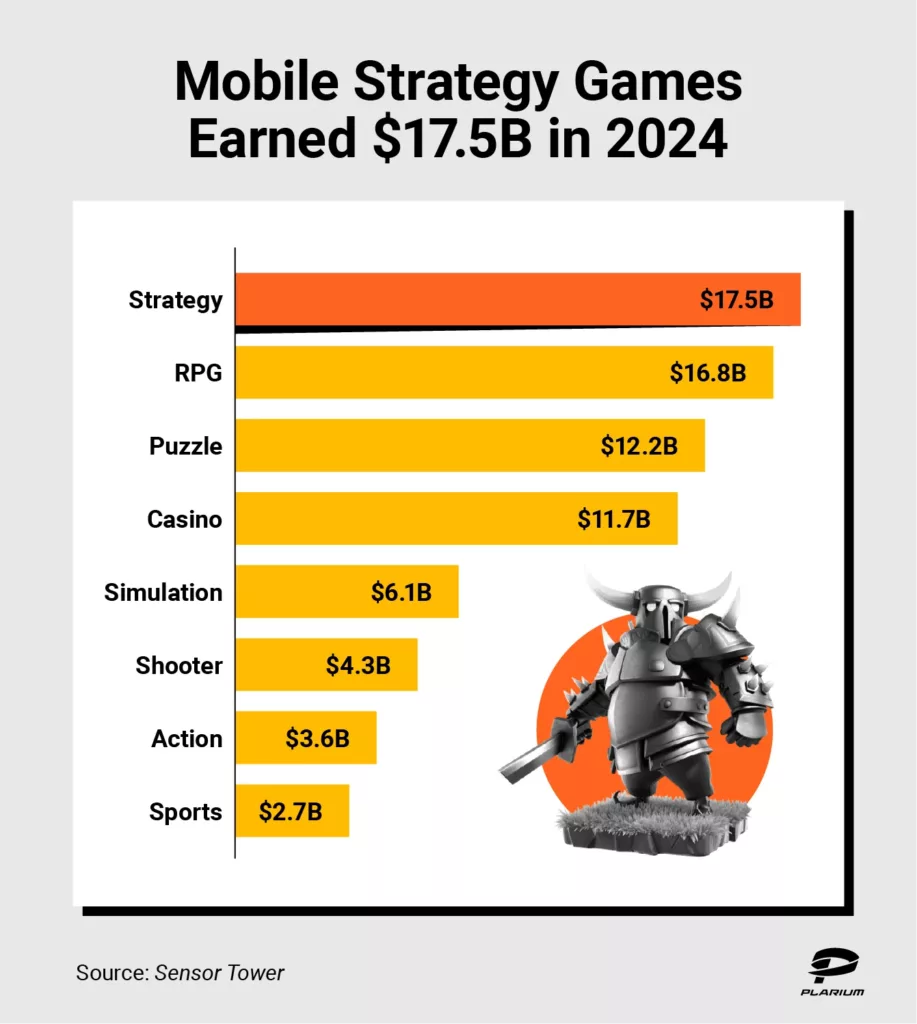
39. In 2024 overall, strategy games generated roughly $17.5 billion and RPGs about $16.8 billion in global IAP revenue. (Sensor Tower)
40. Meanwhile, puzzle games generated $12.2 billion despite being one of the most downloaded genres. (Sensor Tower)
41. Simulator games led in downloads (around 9.8 billion installs in 2024), but their revenue ($6.1 billion) lagged behind strategy and RPGs. This means simulators monetize with a lower IAP yield per install. (Sensor Tower)
What Mobile Gaming Monetization Means for the Future of Mobile Gaming
The mobile gaming market trends are shifting fast. New technologies, like cloud gaming and blockchain/NFTs, and changing ad models are pushing developers to rethink how they earn money. Gamers expect better visual quality, fairness, less intrusive monetization, and more ways to connect — games that deliver those things will likely win.
Here are some stats that will help you understand what the future of the mobile gaming monetization landscape will look like:
42. In 2024, mobile gaming in-app purchases worldwide reached $81.7 billion, increasing ~3.9% from 2023. (Sensor Tower)
43. The highest-grossing mobile game in 2024 was Honor of Kings, with revenue around $2.6 billion. (AppMagic)
44. About 76% of gamers say cross-platform play is moderately to extremely important when choosing what to play. (Plarium)
45. More than 70% of gamers are influenced to try a game by stunning graphics, even if gameplay looks average. (Plarium)
46. More than 60% of players say that a compelling storyline is one of the most important factors in deciding whether to buy a single-player game. (Plarium)
47. Over 35% of men report preferring multiplayer gaming, compared to about 24.5% of women. This implies that mobile games to play with friends could be lucrative if designed well, especially for male audiences. (Newzoo)
48. About 49.2% of male gamers express moderate to extreme interest in becoming a gaming content creator, versus about 36% of women. This suggests influencer or user-generated content can play into monetization. (Newzoo)
49. In-game ads are a major frustration for 46% of players, while glitches/bugs rank even higher at 47%. Monetization strategies that prioritize ads over experience risk alienating players. (Newzoo)
50. Server lag is frustrating for nearly 34.4% of players. Poor technical performance can undercut retention and thus monetization. (Newzoo)
Play for Fun, Not Just for Purchases
Mobile gaming growth in recent years has reshaped the way we connect with entertainment. What was once a small niche has exploded into a worldwide phenomenon — our video game statistics show that there are more than 2.7 billion players globally.
For many, mobile games are no longer just a distraction — they’re a core part of daily life, offering everything from quick puzzle sessions to immersive adventures with friends. But the real success of gaming isn’t just measured in purchases or monetization. It’s in the joy, creativity, and community that games bring to players everywhere.
Explore a world of mobile games that fit your playstyle and enjoy the experience on your own terms.
Mobile Game Monetization Statistics FAQ
Here are some quick answers to the most common questions about how mobile games generate revenue and what drives their success.
What Are the Key Metrics Tracked for Mobile Gaming Revenue?
Key metrics include average revenue per user (ARPU), daily active users (DAU), monthly active users (MAU), in-app purchase volume, and ad revenue. These numbers help publishers measure player engagement and overall profitability.
What’s the Monetization Model of Gacha Games?
Gacha games use a lottery-style system where you spend in-game currency (earned or bought) to unlock random items, characters, or rewards. This model encourages repeated spending because most players often chase rare or exclusive content.
How Do Free-To-Play Mobile Games Make Money?
Free-to-play games earn revenue mainly through in-app purchases, like power-ups, skins, or extra lives, and in-game ads. Some also offer battle passes or subscriptions for players who want premium content without upfront costs.